高德开放平台GeoHUB初用(Vue使用高德地图Loca 2.0)

高德开放平台GeoHUB,高德不声不息出的这玩意挺吊的。

以往地图打点、连线、做特定地市的区域地图,都不知道哪里找GeoJSON数据的,现在有这东西就超级方便了。结合高德地图的api,挺好用的了。这里通过Loca.ScatterLayer的来展示下GeoHUB的简单使用。

知识

实现

components – map – locaPoint.vue

呼吸点的加载代码主要如下,制作geo地图数据具体过程参考下节GeoHUB制作地图geo数据相关介绍

1
2
3
4
5
6
7
8
9
10
11
12
13
14
15
16
17
18
19
20
21
initBreathPoint() {
this.breathPoint = new Loca.ScatterLayer({
loca: this.loca,
zIndex: 113,
opacity: 1,
visible: true,
zooms: [2, 22]
})
// 这里加载geo地图数据
this.breathPoint.setSource(this.geoLevelF)
this.breathPoint.setStyle({
unit: 'meter',
size: [520, 520],
borderWidth: 520,
borderColor: 'rgba(250,250,250,1)',
duration: 500,
animate: true,
texture: 'https://a.amap.com/Loca/static/loca-v2/demos/images/breath_yellow.png',
color: 'rgba(200,200,200,1)'
})
}

GeoHUB 制作地图geo数据

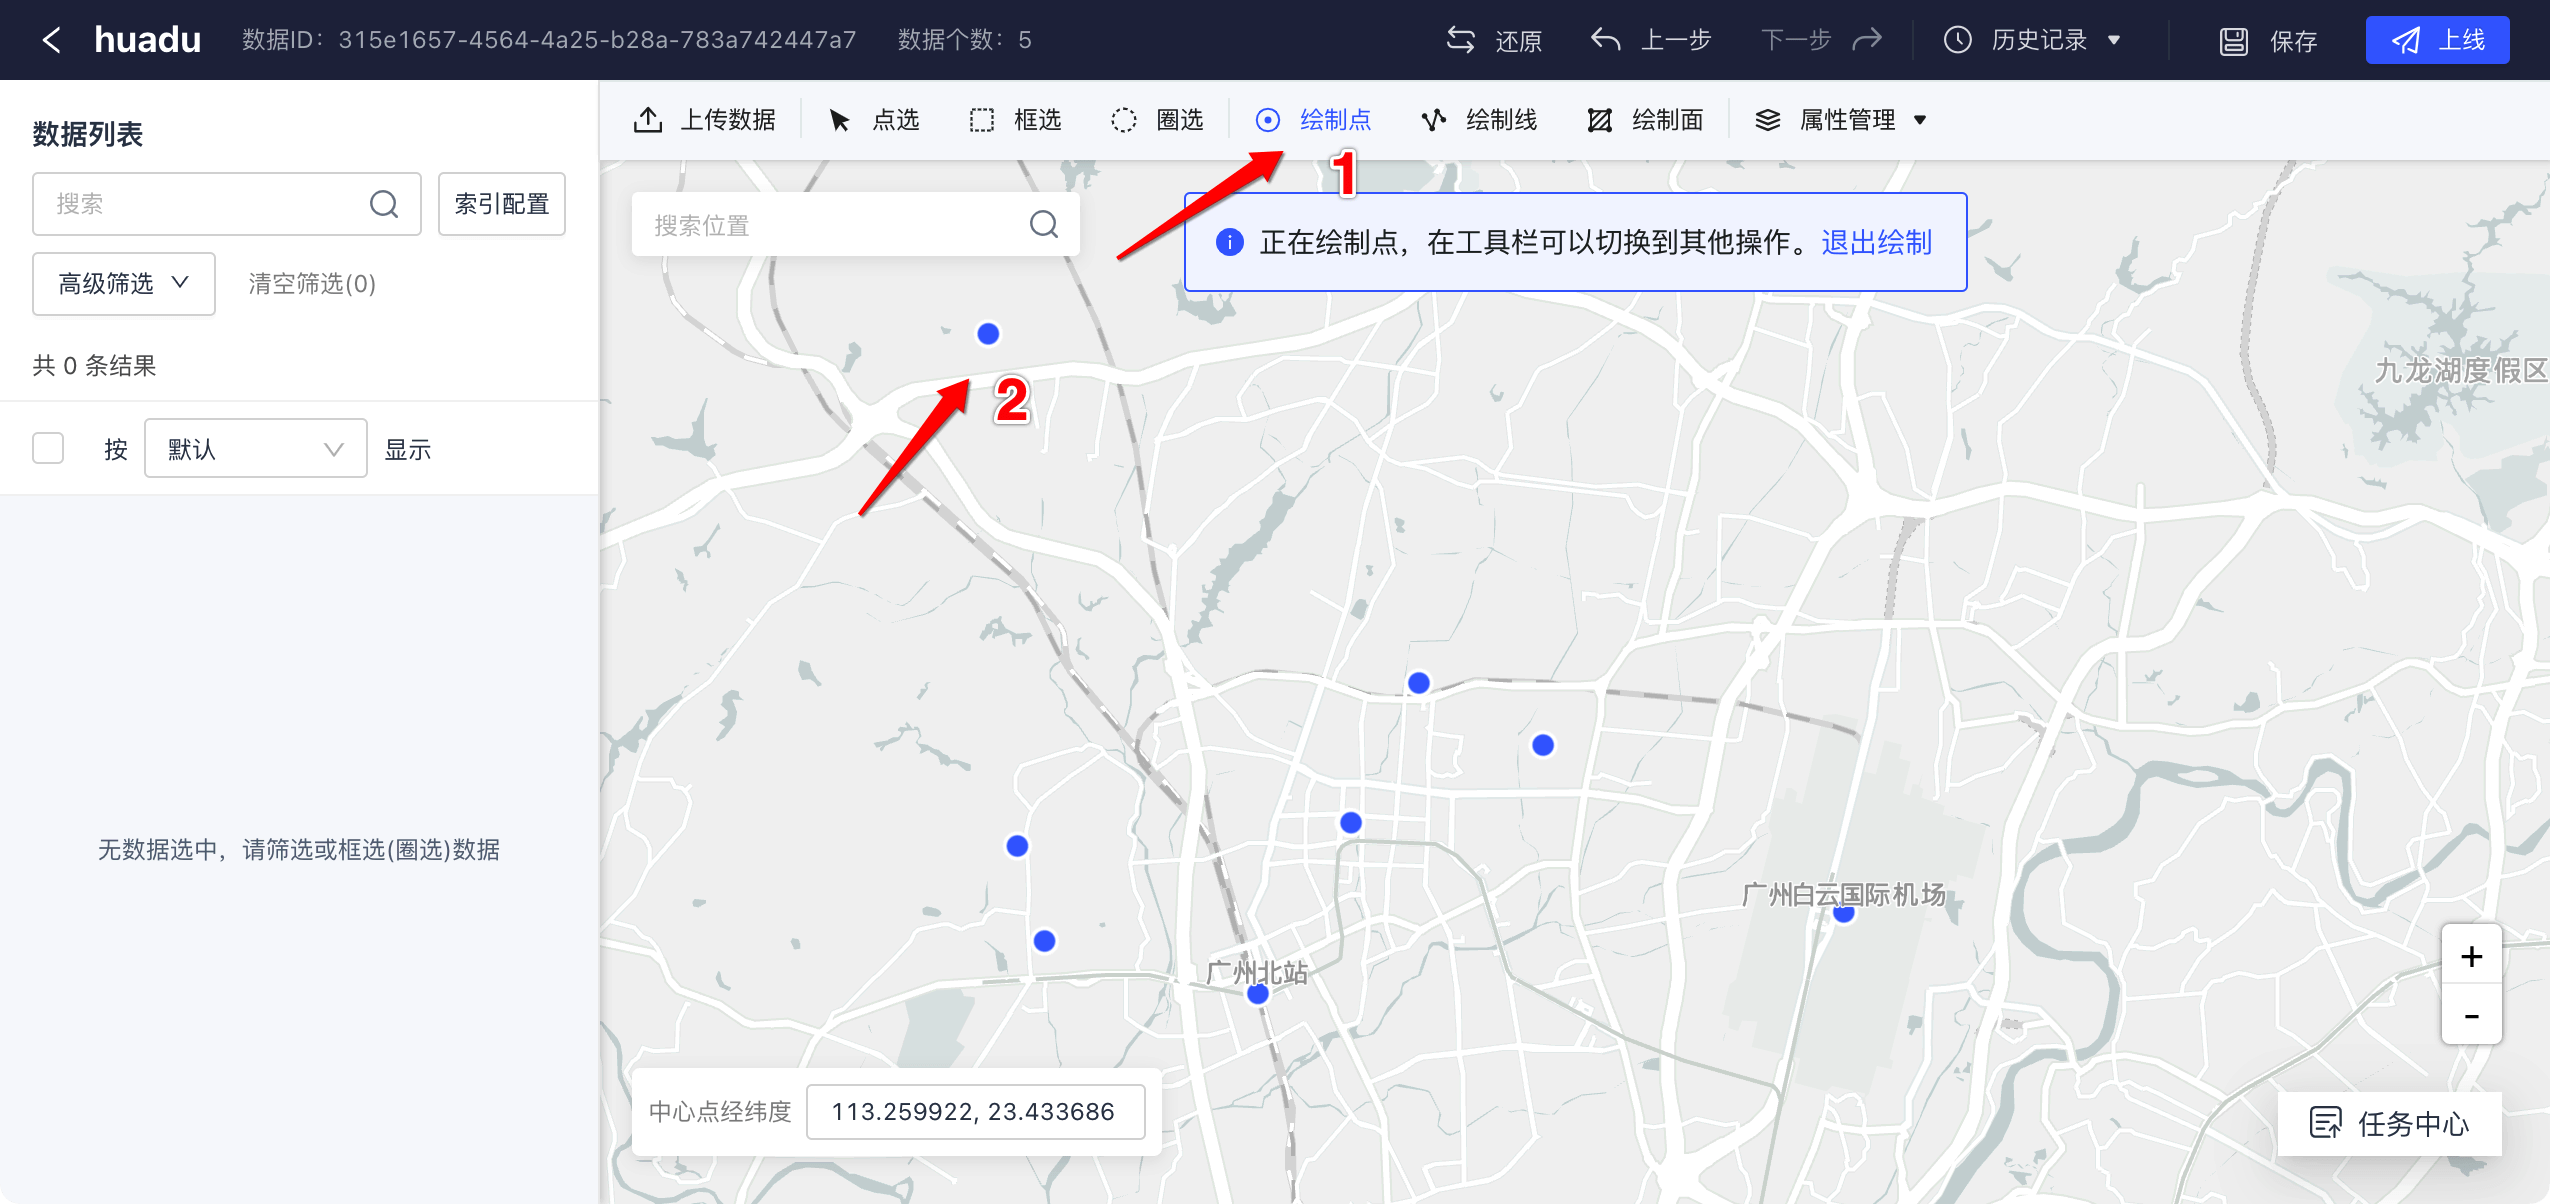
  • 1、选择绘制点功能,然后就可以在地图上标点。具体位置可以在搜索栏搜索定位。这里随便选了几个地点。

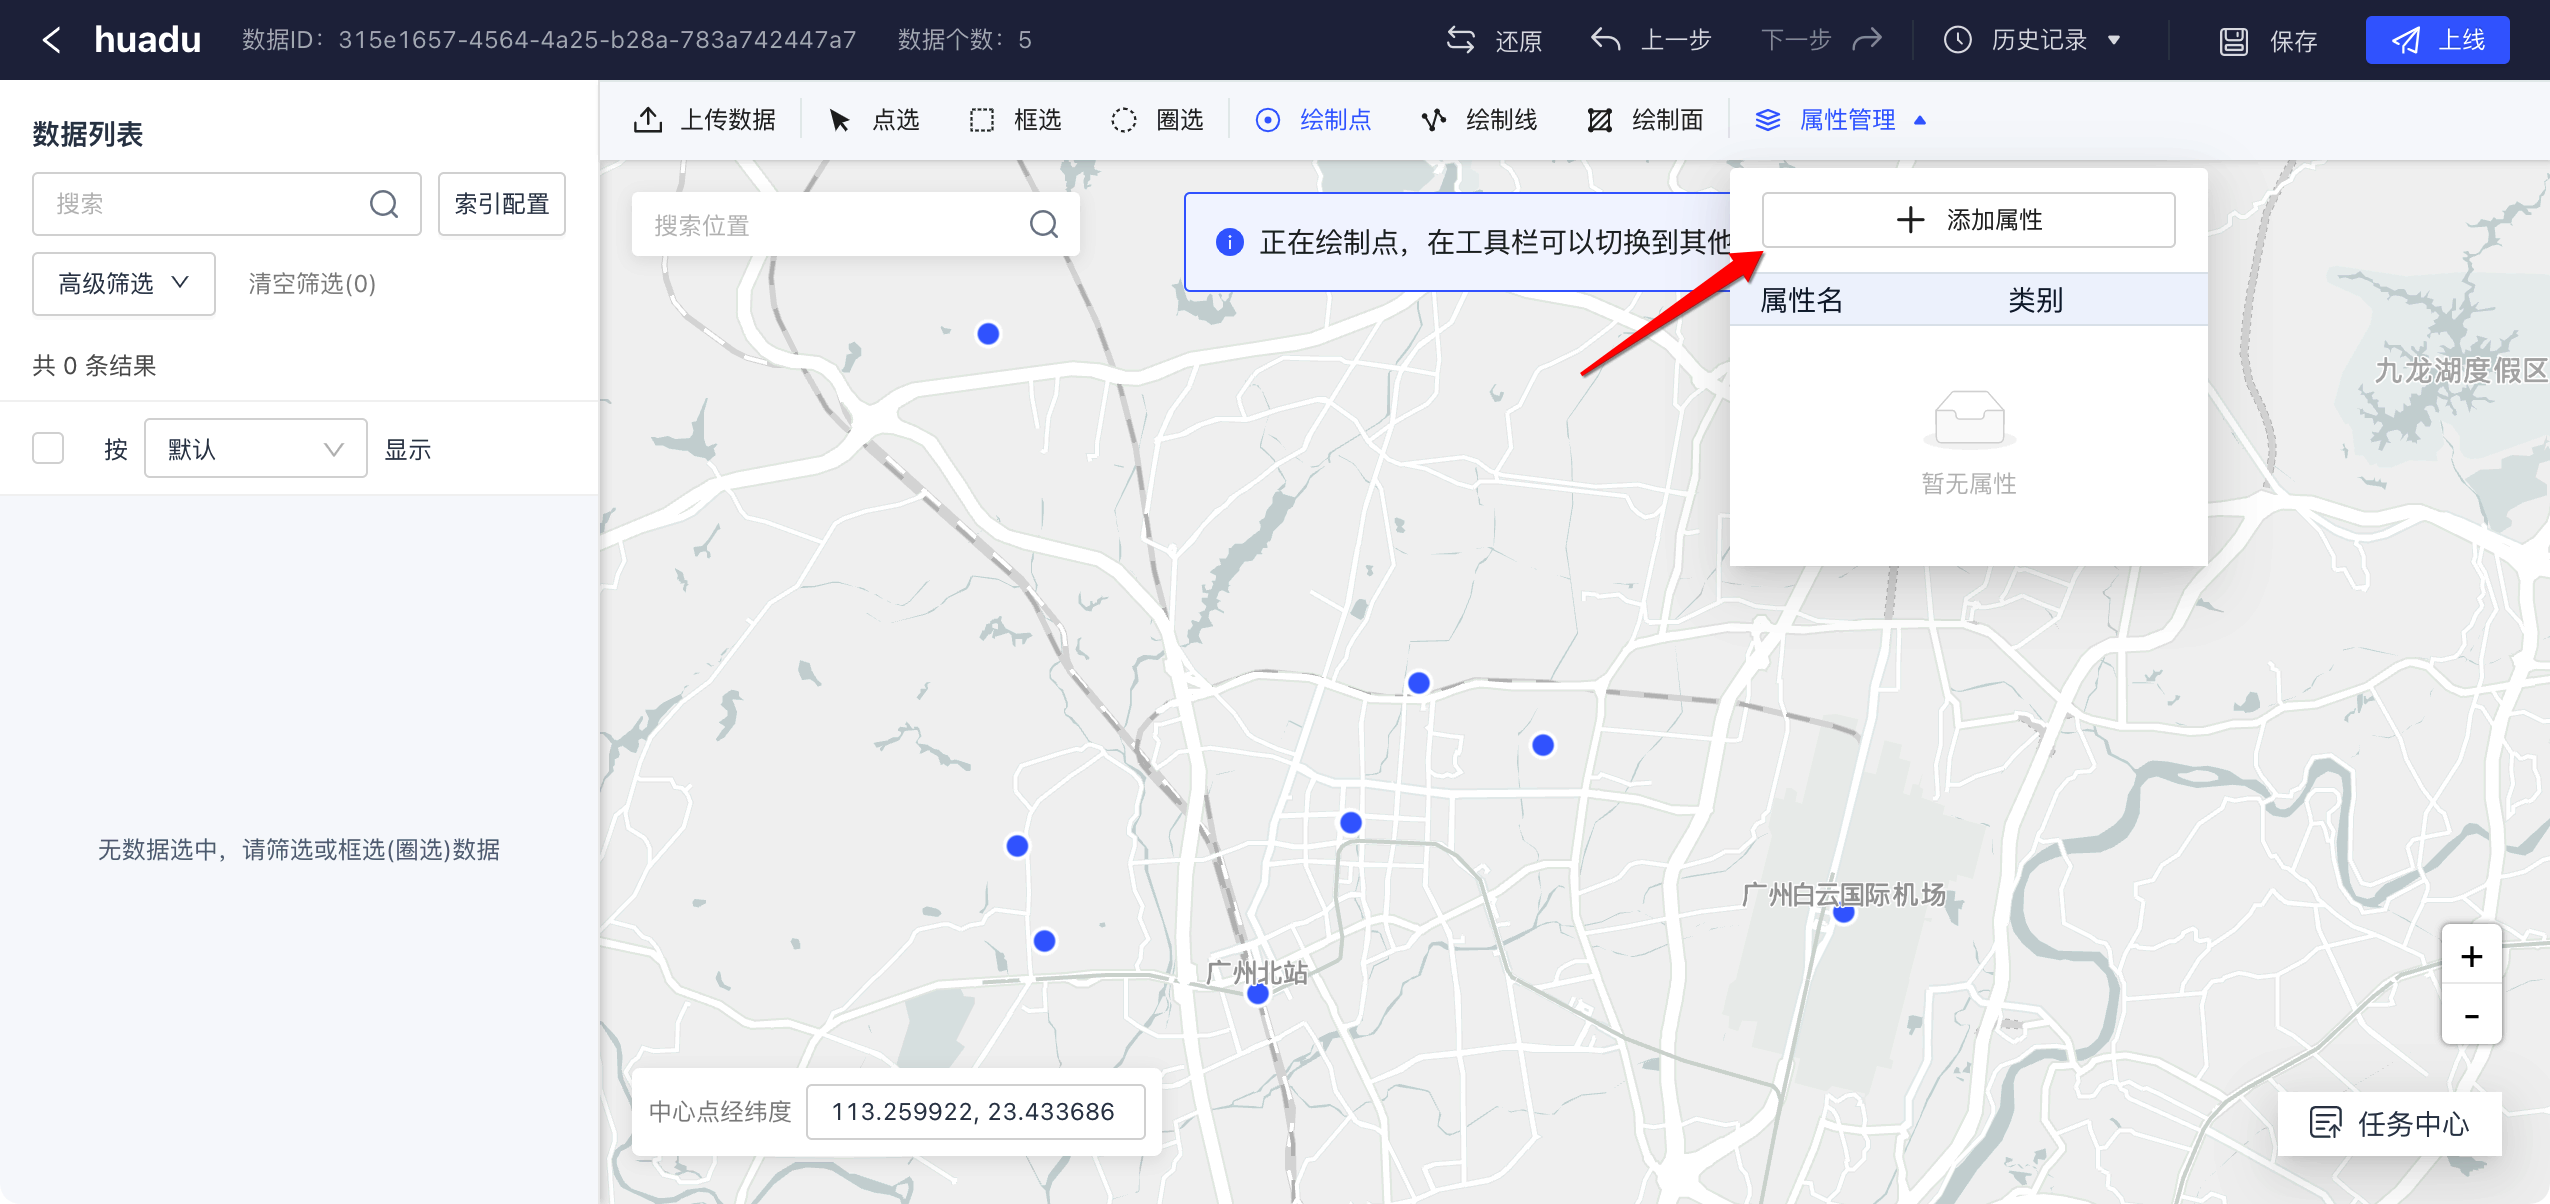
  • 2、如果对数据有定制要求,可以添加自定义的属性字段。例如类型、颜色、分组……

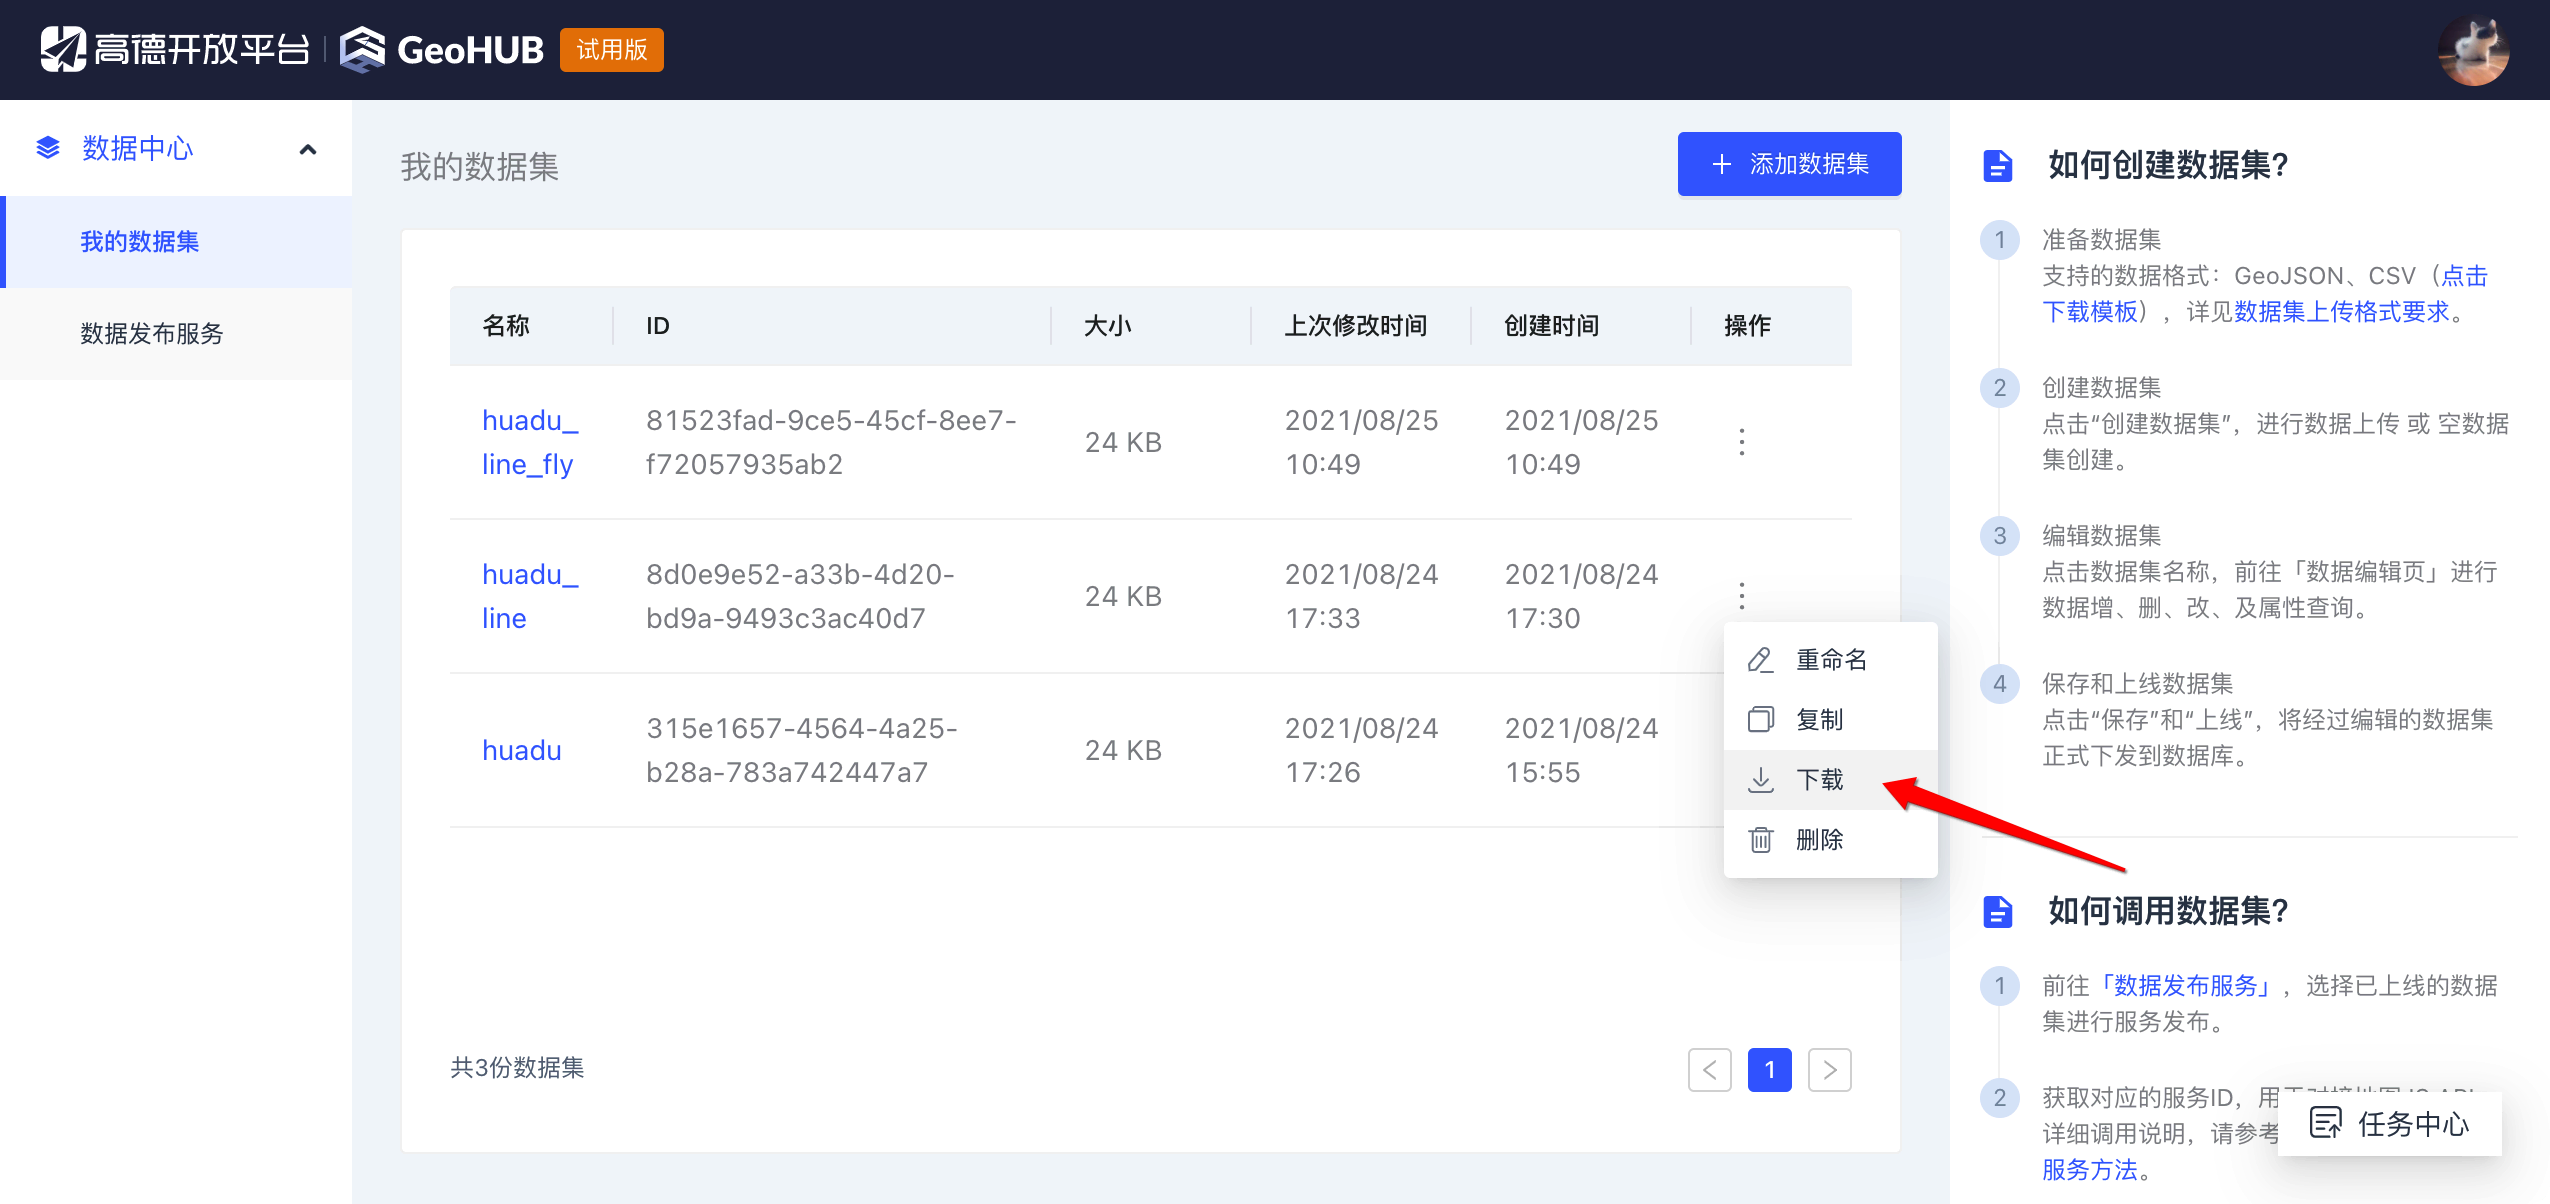
  • 3、点击保存后,返回数据集列表。点击下载,得到一个huadu.geojson的文件。

  • 4、huadu.geojson文件内容如下,标准的geo地图数据格式
1
2
3
4
5
6
7
8
9
10
11
12
13
14
15
16
17
18
19
20
21
22
23
24
25
26
27
28
29
30
31
32
33
34
35
36
37
38
39
40
41
42
43
44
45
46
47
48
49
50
{
"type": "FeatureCollection",
"features": [
{
"type": "Feature",
"properties": {},
"geometry": { "type": "Point", "coordinates": [113.220125, 23.404326] }
},
{
"type": "Feature",
"properties": {},
"geometry": { "type": "Point", "coordinates": [113.203846, 23.377273] }
},
{
"type": "Feature",
"properties": {},
"geometry": { "type": "Point", "coordinates": [113.254308, 23.416872] }
},
{
"type": "Feature",
"properties": {},
"geometry": { "type": "Point", "coordinates": [113.232409, 23.426934] }
},
{
"type": "Feature",
"properties": {},
"geometry": { "type": "Point", "coordinates": [113.161159, 23.400596] }
},
{
"type": "Feature",
"properties": {},
"geometry": { "type": "Point", "coordinates": [113.166207, 23.385075] }
},
{
"type": "Feature",
"properties": {},
"geometry": { "type": "Point", "coordinates": [113.307605, 23.389929] }
},
{
"type": "Feature",
"properties": {},
"geometry": { "type": "Point", "coordinates": [113.235221, 23.496927] }
},
{
"type": "Feature",
"properties": {},
"geometry": { "type": "Point", "coordinates": [113.155997, 23.483681] }
}
]
}
1
2
3
this.geoLevelF = new Loca.GeoJSONSource({
url: publicPath + `/data/huadu.geojson`
})
  • 6、设置呼吸点数据,加载到地图上显示
1
this.breathPoint.setSource(this.geoLevelF)
  • 7、效果

代码总览

涉及的文件如下(具体参考代码):

1
2
3
4
5
6
7
8
9
10
11
12
|-- public
|-- data
|-- huadu.geojson
|-- src
|-- components
|-- map
|-- locaPoint.vue
|-- views
|-- amapLocaTest // 实例所在
|-- index.vue
|-- index.scss
|-- index.js

代码

代码总览的目录去代码里找着看就行了。

总结

以上,只是简单的使用了geohub绘制点功能。还有绘制线、绘制面、自定义属性、上传数据、发布数据服务等功能有兴趣的自行探索了。

代码里面用Vue演示了高德地图Loca 2.0的一些数据可视化效果。除了呼吸点,还有脉冲线连接线,具体看代码了。