vue项目中封装echarts的比较优雅的方式
场景
- 1、Echarts使用时,都需要写一堆的option,如果每个图表都要写一个,一个文件里面的代码量是很大的
- 2、不方便复用
需求
- 1、方便复用
- 2、展示类的图表,数据与业务、样式分离,只传数据就行
- 3、项目里需要用到的图表会有多个,实现少代码自动化导入,不需要一个个import
- 4、本人图表用在大屏数据可视化的情况比较多,采用的是等比缩放的方式,所以图表也能根据界面缩放自动缩放,不需要手动调用
- 5、图表可配置
实现
components–chart–index.vue
这里定义了一个名为ChartView 的组件,开放了4个可配置的属性:宽度width,高度height, 是否自动调整大小autoResize(默认是), 图表的配置chartOption。
这里默认用Canvas 渲染图表了,也可以用SVG的,自选吧
具体代码如下
1 | |
components–chart–index.js
这里主要利用require.context,把options里面定义的图表遍历导入,这样就不需要在代码里一个个import了,特别是图表多的时候。
1 | |
components–chart–options
这里展示下如何封装自己想要的图表
在Echarts官方示例上随便选了个示例
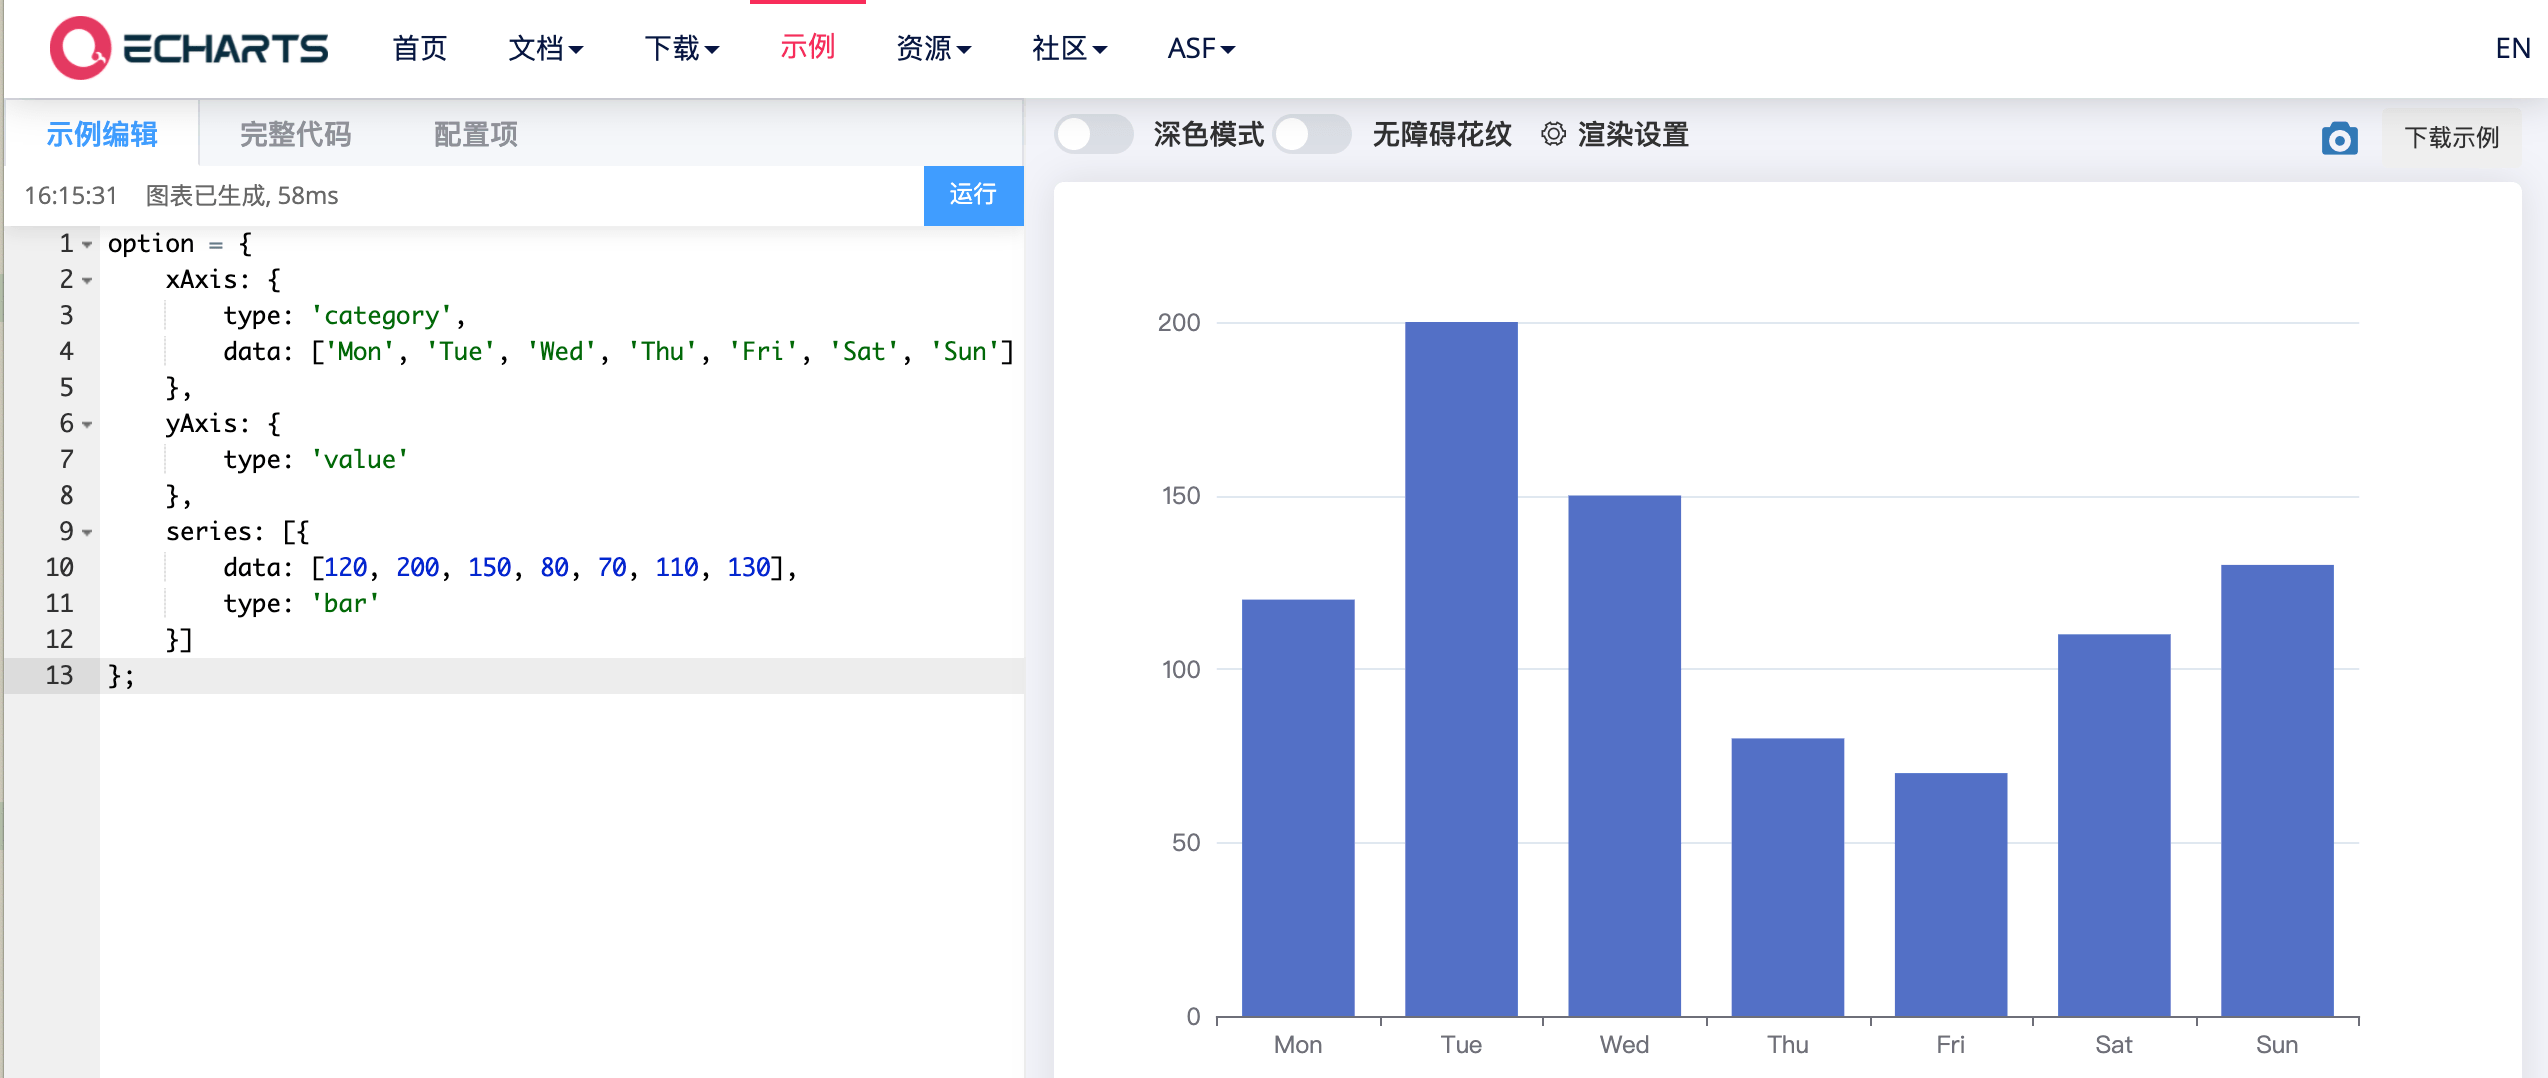
在options下新建一个bar目录,bar目录下新建一个index.js文件。(个人习惯而已,喜欢每个图表都独立文件夹存放。不喜欢这种方式的,可以不放目录,直接js文件,但是components--chart--index.js要对应修改下)
直接复制示例的option代码
index.js具体代码如下
1 | |
testBar方法是可以传参的,具体使用的时候,图表所需要配置的属性,如:data数据、图表颜色……等都可以作为参数传。
main.js
这里全局引入下封装的Echarts组件,方便界面调用。(至于单个引用的方式,就不必多说了)
具体代码如下:
1 | |
chartTest
这里展示下如何调用封装的bar图表,主要代码如下
index.vue
1 | |
index.js
1 | |
效果如下
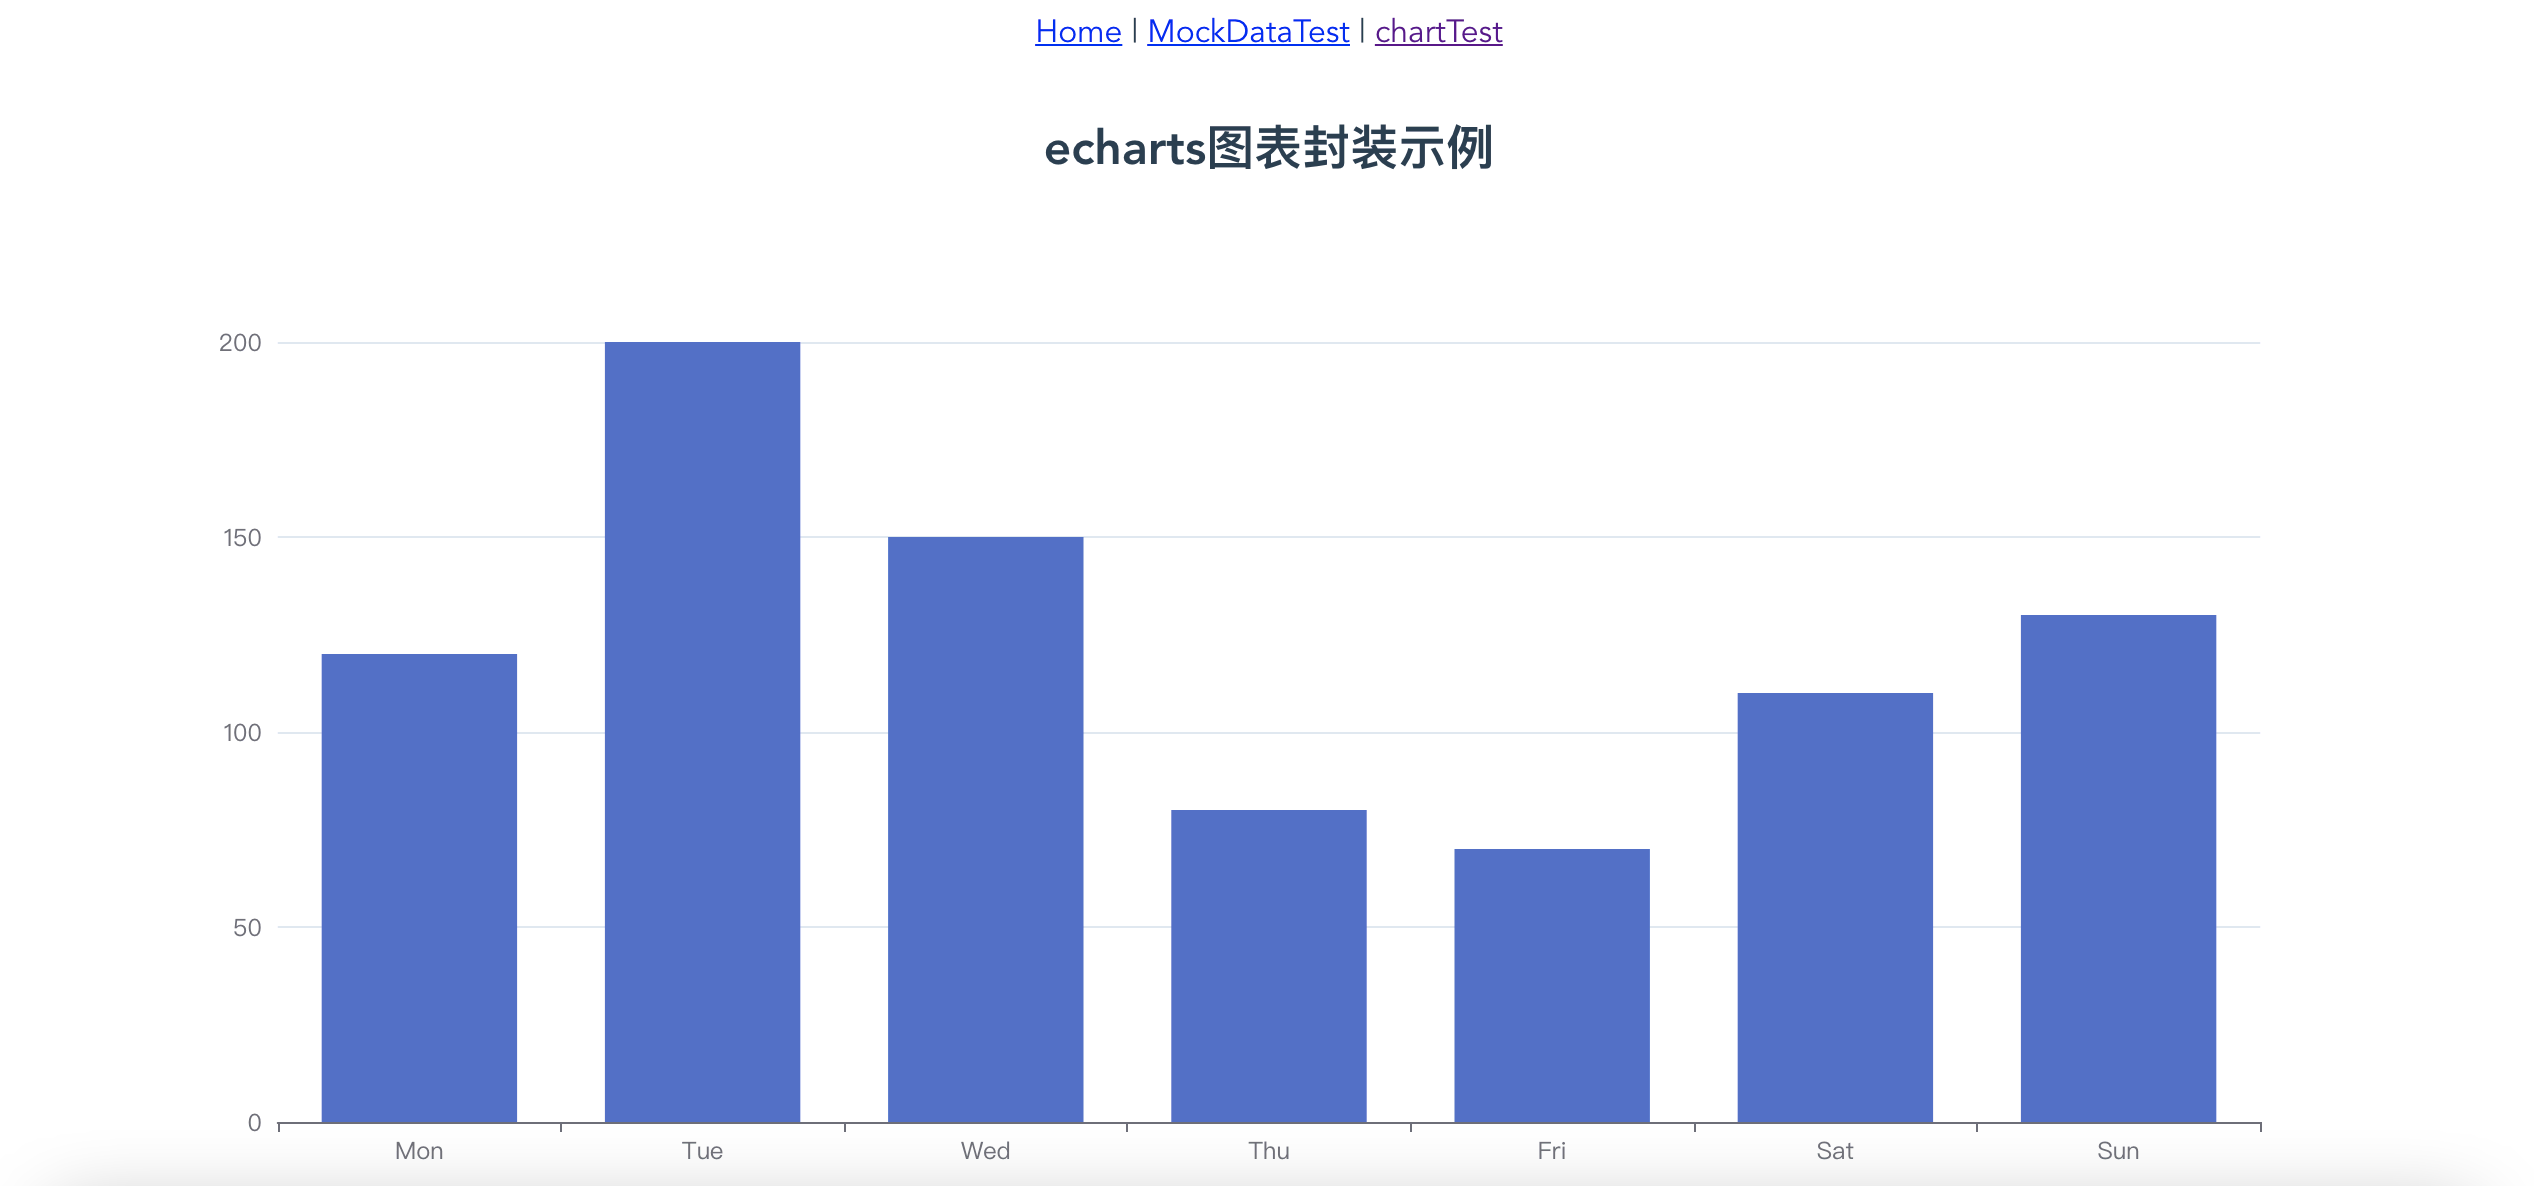
可以尝试拖动浏览器的大小,可以看到,图表也是随着浏览器的拖动自动缩放的。
代码总览
涉及的文件如下(具体参考代码):
1 | |
代码
按代码总览的目录去代码里找着看就行了。
总结
Echarts用到的各种图表,基本上都可以在Echarts官方示例和Echarts可视化作品分享上找到,特别是Echarts可视化作品分享,做项目的时候,可以去参考。
以上,封装了chart组件,按照上述方式,把图表的option配置和相关处理都放options文件夹下面,调用图表时传对应的option,也就几行代码的事情,算是比较方便了。
chart组件很方便复用的,直接就可以使用了。
本博客所有文章除特别声明外,均采用 CC BY-SA 4.0 协议 ,转载请注明出处!